Author: Srikanth Vasudevan

  • Mobile Money is Rewriting the Fraud Landscape in Africa

    Mobile Money is Rewriting the Fraud Landscape in Africa

    Users across the globe are rapidly adopting digital wallets to shop, transact, and pay for utilities using mobile money. Easy, convenient, and real-time, these services are proliferating, particularly in markets where banking access is limited. Take Africa, for example, in just a few years, it has raced ahead as the global leader in the mobile payments landscape, with nearly 161 million active accounts and more than 495 billion dollars in transactions.

    In 2020, this mushrooming industry got new impetus.

    Crippled by COVID-19 in what GSMA calls the ‘Great Lockdown of 2020’ in its recent report State of the Industry on Mobile Money 2021, the world was pushed into a recession, limiting the movement of goods and exchange of cash. But in this crisis, mobile money providers seized their inherent advantages to empower economies by providing financial assistance. Here too, Africa leads the way. The GSMA report states that “In 2020, Sub-Saharan Africa continued to account for the majority of growth with 43% of all new accounts.”

    When we think of mobile money in Africa, M-PESA may be the first name that pops to mind – and rightly so. They were the first player to roll out mobile wallets that doubled up as pseudo-bank accounts. Prolific smartphone access has amplified this trend, extending mobile money beyond banking to something people can use for nearly every service, including booking flights, buying insurance, shopping, foreign remittances, and more. A 2020 report titled Mobile Money and Organized Crime in Africa states that “In September 2019, there were 153 active mobile money operators operating in 45 African countries.” Clearly, this market shows no signs of slowing down.

    Origin of risk

    Every new technology comes with a certain risk, and mobile money is no exception. Running these services means establishing multiple and complex back-end integrations with different players, each of which adds to the risk surface. It has drawn the attention of hackers/fraudsters worldwide as they turn their efforts to exploiting pressure points in the mobile money ecosystem.

    What is worrying is that these loopholes aren’t hard to find.

    Weak ID verification systems, poor customer awareness, insufficient security resources, inadequate training, and limited access to best-in-class fraud detection tools are all challenges that make breaches and financial theft possible.

    Regulations are another challenge. Most regulators are struggling to keep pace with how fast the technology is advancing. Striking a balance between user experience and data safety is a constant wrestle. Moreover, as laws take time to catch up, the criminal justice system lags at apprehending offenders. The African Mobile Money report captures this succinctly, stating, “The lack of resources and training of law enforcement concerning the collection and use of technical evidence in the criminal justice system has resulted in difficulties in prosecuting offenders and tackling established organized crime groups.” Further, the low onboarding barriers for mobile money make it a lucrative channel for terrorist financing and money laundering via cross-border payments and international remittances. Without the right checks and balances and cross-country governing rules, mobile money regulatory frameworks tend to be weak, leading to cracks in implementation, particularly pan-country, making it harder to monitor money laundering activities.

    So, what does mobile money fraud look like?  

    Briefly, these include:

    • Customer Acquisition Frauds – Abuse of identity documents to create fake accounts on the platform.
    • Identity Theft – This involves SIM swaps where fake ID proof is used to procure duplicate SIM cards for online transactions, leading to account takeovers.
    • Transaction Frauds:  The mobile money account holder can perform an increasing number of transactions. The number and variety of operations have grown immensely in the recent past. Some of the types of transactions are as follows:
    Representative mobile money transactions
    Figure 1: Representative mobile money transactions
    Source:https://enactafrica.org/research/interpol-reports/mobile-money-and-organised-crime-in-africa

    However, fraudsters can exploit various loopholes in these processes to commit fraud. In transaction frauds, stolen cards, data, or accounts are used to perform unauthorized transactions like income tax refunds, fake social media accounts, phishing, etc.

    • Money Laundering –Money laundering is the illegal process of making large amounts of money generated by criminal activity, such as drug trafficking or terrorist funding, appear to have come from a legitimate source. Money launderers can exploit mobile money services to transfer the proceeds of crime to co-conspirators located in other countries, or supporters of terrorist organizations can exploit.
    • Internal Frauds – Frauds conducted internally by merchants or employees with access to customer information.

    Uganda’s mobile money network took a significant hit on October 3, 2020, when one of the companies providing services to telecom companies was exploited by fraudsters, leading to 3.2 million stolen dollars. The theft was executed through unsuspecting telecom companies, and money was exchanged through mobile money payment systems using 2000 SIM cards. Many reasons are implicated in the execution of this fraud, including malicious telecom agents, fake KYC, and spurious campaigns.

    Clearly, the challenges of verification and identification are the weakest links. Without being able to clarify whether transactions are authentic, issues like money laundering for terrorist financing emerge. As stated in the Mobile Money and Organized Crime in Africa report, the sheer diversity of national ID documents as well as low national ID coverage in Africa further compound this challenge.

    Need for a Multi-Pronged Strategy 

    With mobile money adoption rates increasing in Africa bearing the promise of even more growth, mobile operators and digital wallet companies need a proactive mindset to stay ahead of fraud. Well-defined training programs, for instance, can educate customers and internal teams on the different types of fraud risk and vectors. Implementing the right fraud management tool, which has the capability to monitor suspicious activity related to internal employees, partners, agents, sanctioned lists, etc., and outfitted with robust AI/ML capabilities that track millions of daily transactions and detect abnormal behavior is extremely important. Further, when coupled with Anti-Money Laundering (AML) capabilities like risk categorization, suspicious activity monitoring, and AML watchlists, such solutions provide a robust defense, helping operators ensure themselves from the evils of mobile money fraud.

    Subex enabled a Tier-1 African Operator to uncover Mobile Money Fraud and help them save USD 3 million

    Download Case Study

    Sukshitha Rao is a Product Marketing Specialist responsible for Fraud management portfolio at Subex. She is a postgraduate in management from Symbiosis Institute of Digital and Telecom Management with Marketing as her major. She has about two years of work experience in the IT industry.

  • Anomaly Analytics: It’s Role in 5G and Assurance

    Anomaly Analytics: It’s Role in 5G and Assurance

    Introduction

    According to the latest trends and reports published by industry forums, by mid-2021 5G adoption would have reached around 250 million active subscribers from this year’s 80 million accounting for an increase of almost 200%. Though this increase is substantial, in the larger scheme of things, 250 million subscribers only account for 3% of the total mobile subscription globally. Furthermore, revenue predictions for 5G also state that 5G technology will not boost revenues but give a telecommunication service provider far more flexibility in the business models that can be deployed within the larger eco-system.

    This fact also means from an assurance perspective; the telecommunication service provider will need to invest in far more hardware and the associated services to onboard 5G services into the revenue assurance practice. While this may not be a significant investment initially considering the low adoption of 5G. However, this trend takes a significant turn as we go into the year 2022 to 2025, wherein the 5G service is expected to account for 30% adoption, thereby exponentially increasing your data volume, the hardware footprint and the OpEx required to perform daily revenue assurance activities for 5G services. At the end of the day with falling ARPUs, the discrepancies quantified will not justify the investment made towards onboarding 5G services into the traditional revenue assurance practice.

    You will need to look for a newer approach that provides a better cost vs benefit.

    Pressure on ROI from RA investments Traditionally revenue assurance involves the process of taking two or more datasets between the switch and billing and reconciling them to identify usage that was not billed due to issues in the data sent downstream. During 2G services, this volume for a tier 1 operator was anywhere between 100 million to 500 million xDRs, which required to be reconciled daily. However, with 3G and 4G service, this volume exponentially increased due to the larger mobile service adoptions and the associated services being provided. Today for a tier 1 operator with 100 million subscribers, the revenue assurance tool is required to reconcile anywhere from 5 billion to 10 billion xDRs daily. With ARPUs falling year on year, there is a significant pressure on the revenue assurance practice to justify the return on the investment made by the organization to plug leakages, a goal that will become significantly harder to reach.

    5G will only carry forward this trend at an even faster pace.

    Role of Anomaly Analytics

    As an example, let us look at a hypothetical revenue assurance setup. For an operator with 100 million subscribers, you will have anywhere from 10 billion to 5 billion xDRs generated daily. This data is then either stored in your data warehouse or your big data lake. Here the revenue assurance practice will require data to be processed individually, loaded in the tool, reconciled daily, and retained for 30 days with the goal being to identify revenue leakages. This setup would require significant investment on hardware which can run into millions of Dollars on its own, excluding the cost of license, deployment, support and manpower.

    Here we employ an Anomaly Analytics methodology, which significantly simplifies the TCO and the complexity of reaching the end goal. Taking the same hypothetical revenue assurance setup as above. The data stored in the data warehouse or big data lake can be aggregated accordingly to specific dimensions such as type of subscribers, cell site, rate plans, type of services, and measured against various metrics. In this hypothetical approach, only the aggregated data is processed using anomaly detection to monitor millions of KPIs, identify discrepancies quicker and correlate with other associated datasets. The approach here significantly uses lesser hardware and provides near real-time insights to only KPIs wherein the solution derives as a genuine discrepancy. More importantly, we achieve the same goal of identifying discrepancies.

    Traditional Reconciliation vs Anomaly Analytics Approach

    The point of concern between the traditional reconciliation and the anomaly analytics approach is that with the latter, the missing data identified by the prior is not readily available. In the anomaly analytics approach, one must dive into the data in the data warehouse or the data lake to identify the granular data. So we arrive at the question if it is worth investing is an anomaly analytics approach even if one does not have ready access to the granular data?

    As mentioned earlier, as a trend,we see a drop in ARPU; regardless of the service, the value of a single unit of measure, in this case, xDR, is trending downwards. As of last year, the ARPU dropped by 2% in the developed market (America and Europe) and by 18% in the developing market (South East Asia). This translates to the fact that if one identifies say 10,000 xDRs missing at a value of $1000, this value drops by a percentage every year due to the growing service usage and the drop in prices. Ultimately the question of going with an anomaly analytics approach for revenue assurance reconciliation is a question of “cost vs benefit.”

    Conclusion

    With newer 5G services, we see  a significant shift in our approach to revenue assurance and especially reconciliations. The term “single source reconciliation” has taken birth due to anomaly detection allowing the business to analyze the data and obtain insights on service, quality, billing, and service orchestration from a single source of data processed over a short period. While we are in the early stages of this approach, we are certainly expecting anomaly analytics to take the initial steps within a revenue assurance function and grow to become the mainstay within a couple of years.

    Want to know how Anomaly Analytics can play a role in 5G Assurance?

    Schedule a demo!

  • Creciendo más allá del Aseguramiento de ingresos: el auge del Aseguramiento Empresarial

    Creciendo más allá del Aseguramiento de ingresos: el auge del Aseguramiento Empresarial

    Tradicionalmente, las funciones de aseguramiento de ingresos han estado monitoreando los flujos de ingresos desde el cambio a la facturación, con el objetivo principal de detectar fugas, generalmente con una latencia de más de 24 horas. Con el éxito de la función de garantía de ingresos en sí misma, que se mide sobre el valor de la fuga que se identifica, mayor es el hallazgo y mayor es el éxito de la función de aseguramiento de ingresos. Siendo un modelo que ha estado funcionando desde la era de los servicios 2G, todas las funciones de RA se construyeron sobre la base de la identificación de fugas.

    En el extraño caso de tener una asignación de servicios casi perfecta y la medición de un flujo de ingresos, la función RA se ve obligada a expandir los controles a las nuevas áreas y tecnologías en la búsqueda para encontrar la fuga evasiva. Esta búsqueda de validar el propósito de la existencia de la función RA comienza y termina año tras año, lo que demuestra ser un desafío importante con la disminución de los ARPU (Average revenue per user/Promedio de ingresos por usuario) y el costo por llamada / transacción.

    Eso nos lleva a una pregunta importante. ¿Puede la fuga ser la única medida para una función RA?

    Los fabricantes de automóviles alemanes emplean un método llamado FMEA (Análisis eficaz del método de falla) que les permite alcanzar un porcentaje casi cero de fallas desde el diseño hasta la fabricación, ya que una falla menor a veces puede ser catastrófica para un usuario final o provocar la insatisfacción del cliente. Por lo tanto, el objetivo final es que la ausencia de fallas es una correlación directa con el éxito de los programas de mitigación de riesgos, un enfoque que es contrario a las prácticas tradicionales de RA.

    En RA ahora estamos evolucionando hacia un camino similar. Si bien la fuga puede ser un parámetro que indica la falla de un proceso, los otros son el monitoreo de ingresos y costos, la gestión de márgenes, la habilitación de CXO y, finalmente, el cumplimiento del cliente que proporciona la base para la ventaja competitiva.

    Evolution-of-RA

    Por ejemplo, como se indica en el gráfico de arriba.

    Moverse a lo largo del eje Y solo aumenta el recuento de controles para una función RA con el único propósito de encontrar fugas

    O bien, si se mueve exclusivamente a lo largo del eje X, brinda una cobertura mínima que no protege todos los servicios ni permite todas las funciones de la empresa

    Por otro lado, una ruta que aumenta linealmente, proporciona una ruta que madura la función de RA con la tecnología cambiante y el ecosistema empresarial, al mismo tiempo que permite diversas funciones y conduce a la organización hacia una ruta impulsada por datos.

    La digitalización ha ampliado enormemente los riesgos generales para las empresas de telecomunicaciones y en la realidad actual de las ofertas multiservicio y multidisciplinarias (p. Ej., Banca, venta minorista, contenido digital, etc.), la función de garantía de ingresos debe pasar de solo asegurar los ingresos (con un enfoque comercial principal en EBITDA) para asegurar modelos de negocio, ampliando el enfoque más allá de la gestión de ingresos a Business Assurance.

    Seminario web OnDemand: Gestión de riesgos empresariales: El crecimiento del Aseguramiento de Negocios.

    DESCARGAR GRABACIÓN

  • Growing Beyond Revenue Assurance: The Rise of Business Assurance

    Growing Beyond Revenue Assurance: The Rise of Business Assurance

    Traditionally revenue assurance functions have been monitoring revenue streams from switch to billing, with the primary goal of detecting leakages usually with a latency of more than 24 hours. With the success of the revenue assurance function itself being measured on the value of leakage being identified, larger the finding, greater the success of the revenue assurance function. This being a model that has been working since the age of 2G services, the entire RA functions built on the foundation of identifying leakages.

    In the rare event of having a near-flawless service allocation and metering of a revenue stream, the RA function is forced to expand controls to newer areas & technologies in the quest to find the elusive leakage. This quest of validating the purpose of the RA function’s existence begins and ends year on year proving to be a major challenge with decreasing ARPUs & cost per call/transaction.

    That brings us to an important question. Can leakage be the only measurement for a RA function?

    German car manufacturers employ a method called FMEA (Failure Method Effective Analysis) that enables them to reach a near-zero percentage of failures from design to manufacturing as one minor failure can at times be catastrophic to an end-user or lead to customer dissatisfaction. Thereby the end goal being that the absence of failures is a direct correlation to the success of risk mitigation programs, an approach that is contrary to traditional RA practices.

    In RA we are now evolving towards a similar path.  While leakage can be one parameter indicating failure of a process, the others are revenue & cost monitoring, margin management, enablement of CXOs and finally customer fulfillment that provides the base for competitive advantage.

    Evolution-of-RAFor example, as indicated in the graph on the above.

    Moving purely along the Y axis only increases the count of controls for an RA function with the sole purpose of finding leakage

    While moving purely along the X axis brings in minimal coverage that does not protect all services nor enables all functions of the business

    A linearly increasing path on the other hand provides for a path that matures the RA function with changing technology & business ecosystem while enabling various functions and driving the organization towards a data driven one.

    Digitalization has greatly expanded overall risks for telcos and in today’s reality of multi-service, multi-disciplinary offerings (eg. Banking, Retail, Digital Content etc), Revenue Assurance function need to move from just assuring revenues (with a primary business focus on EBITDA) to assuring business models, expanding focus beyond revenue management to Business Assurance.

    On-Demand Webinar- Managing Business Risks: The Growth of Business Assurance

    Download Recording

  • The changing business model of Assurance

    The changing business model of Assurance

    It’s been more than a year since I have even looked at my phone bill, lying in my inbox, marked as read, never to be opened. Bundle of services packaged under a single price, only to change by a small margin when India moved to a single Goods & Services Tax framework.

    This is the new world of telecommunication. Select services of your liking, planned well like mine is, you would rarely be looking into your bills, scrutinizing itemized lines and stressing about your usage with  customer care.

    In a recent survey of complaints received at the CCTS (Commission for Complaints about Telecom-Television Services, Canada) while incorrect charging complaints increased by 71% Y/Y, complaints on changes to contracts increased by over 200% Y/Y.

    This trend is one of the key indicators of the change that is emerging in the space of assurance. The others being the steady and continuous interest in mitigation of risks within the partner ecosystem primarily related to contracts, margin, partner invoices, and inventory.

    What’s Changing?

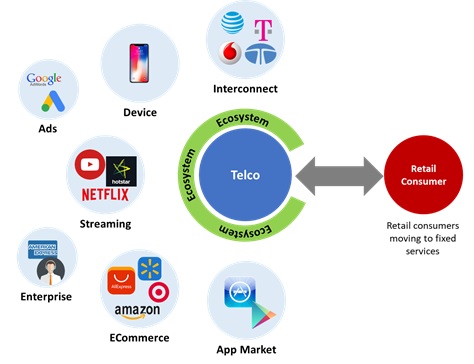
    Today with telcos moving into the domain of content providers with offerings of entertainment streaming, current affairs consumption, shopping, and many more options. All these services are bundled into a highly configurable plan that has an “all you can eat” approach as long as it is within the “Fair usage policy” means for a telco subscription, services, on-boarding, customer intelligence, and QoS are the critical assurance parameters from a retail point of view.

    However, the change being addressed has a pivotal impact from a B2B perspective from the massive complexity of the partner ecosystem.

    partner ecosystem

    Today for a partner ecosystem the risk universe includes devices, direct carrier billing, partner credibility, partner & product margins, pay-in & pay-outs, revenue sharing, contract alignment and many more which needs to be monitored & actioned on at near real time.

    Furthermore, we are not talking just about revenues but also costs and liabilities. So, the new business model of assurance, which we are referring to as “Business Assurance.”

    “Assurance is becoming a source of competitive advantage.”

    Business Assurance is not just a methodology but a major transformation in practice & technology. The new Business Assurance solution will need to:

    • Own and maintain the system that measures data quality
    • Own and maintain the business anomaly detection engines
    • Manage & drive business intelligence & insights
    • Measure and anticipate the impact of changes or offerings on customers
    • Monitor the content & partner environment for business feasibility and continuance
    • Gain a comprehensive understanding of revenue & cost breakdown in the organization
    • Help in assuring the “business model” itself, as opposed to a line of business

    In short Business Assurance is the new Revenue Assurance. It is not a question of if this transformation will happen but when will it happen? If it hasn’t yet started, it will.

  • Reporting “The Smart Way” in RA

    Reporting “The Smart Way” in RA

    “As is”
    Read the news using your favorite news app on your smart phone or device? Notice how the app renders news items that are important to you or of interest to you and stacks them together with short headlines followed by a short summary thereby making sure that one wouldn’t need to feel short of time finding what really needs to be read.

    Is this done in your RA department?

    The below diagram illustrates how majority of the RA departments report the necessary information to all concerned departments and how the subsequent action items are publicized and owned by various departments.

    Reporting2

    In majority of RA functions the following gaps exist in the reporting of findings and their subsequent action points:

    • Reports rarely designed with specific information that is immediately consumable by target audience
    • Reports rarely designed with specific requirements to the target audience than can be easily converted to action items
    • Majority of the RA operations use one reporting template for all business functions

    “Smart Reporting”
    The below figure illustrates the ideal modus operandi that requires to be followed in a RA reporting structure.

    Reporting1

    Key improvements in the model are as follows:
    • Reports specifically designed to target audience. For example: Reports to CxO will address revenue & cost savings, key mitigation measures taken, not exceed a time length of 5 minutes and requiring specific actions / escalations
    • All reports to address specific actions required from various business functions and will be time bound
    • Organizational news feeds will be made part of RA reporting

    Here the emphasis is on smart reporting, which can be quickly consumed and acted upon.

  • Revenue Assurance and LTE

    Revenue Assurance and LTE

    Emergence of LTE

    Through the last one decade when telecommunication globally evolved from 2.5G to 3.5G taking along the subscribers from a mere 56 Kbps to streaming of HD videos & music on your handset, data and content has evolved by giant leaps far faster than anyone predicted. The evolution not only provided a broad variety of services to the end users but also magnified the economics of content provision, VoIP services and eCommerce by leaps and bounds.

    A far cry from just using you mobile phone for voice and SMS, the thirst for data from the end users of today sends out a clear message that even the speeds offered by 3G networks fall short of the requirement. So much so that this evolution is slowly but steadily diminishing the traditional circuit switched voice traffic.

    The below stats geographically indicated illustrates the current data evolution:


    Risk Profiling

    The evolution of LTE differs not only from an end user product offer perspective but also from the point of network architecture. This makes LTE evolution very different from the 3G evolution wherein only a few components changed along with minor adjustments in xDR formats. These minor changes resulted in majority of the core RA practices to accommodate a 3G risk mitigating process with minor adjustments to already existing controls.

    However this would not be the case when it comes to LTE wherein majority of the network components are different with layers of complexity that originates from the perspective of how products are designed and offered.

    • Product Design

    When it comes to how RA facilitates product design in an LTE network we must take note of the fact that very few RA practices today have a functioning RA process that contributes to marketing campaign, product offer development and change management in a 2G / 3G / fixed line / broadband environment. The primary reason being that majority of the RA operations still concentrate towards leakage detection and not revenue enhancement.

    However in the case of LTE where subscribers have access to multitude of content and eCommerce in a market which is growing at a rate of 30% – 55% at any given geographical market coupled with thinning bottom lines, here RA processes for product design becomes far more important in the insights that can be generated through various multi-dimensional usage modeling.

    •  Order Management & Provisioning

    Unlike a 2G & 3G environment wherein the subscriber service configuration is spread across the order management system, HLR, IN and billing in an LTE scenario the scope of risk is drastically amplified due to the dynamic allotment of service elements in the PCRF as per a designated service plan.

    Herein any risk mitigation process begins with the analysis of services allocated at order management, subscriber’s historical usage and the subsequent policies that are dynamically enforced by the PCRF.

    • Rating and Billing

    LTE brings in complexities within each service plan wherein the rating differs across each and every data session initiated by a subscriber. For instance, if a subscriber is streaming a video / music and simultaneously texting through a popular messaging service the corresponding rating will also differ specific to the plan associated to a session; in this case video stream will be rated differently from the messaging service. Here again to add another layer of complexity, rating can also differ on the QoS guaranteed to an end user.

    Evolution of RA

    It becomes fairly clear that majority of the traditional controls that has been used for a 2G & 3G scenario cannot be reused for RA in LTE thereby paving the way for RA evolution along with the corresponding LTE evolution.

    One of the important takeaways in the evolution of RA is the importance of analytics for revenue reporting / projections through multi-dimensional data modelling which is a must in a LTE environment which thereby provides a multitude of insights on subscribers, products, network utilization and revenue generation.

  • Mobile data offloading & Revenue Assurance

    Mobile data offloading & Revenue Assurance

    Emergence of mobile data offloading

    Though mobile data offloading is not new to the industry it is catching steam off late and that has made operators around the world take notice. The factors that are driving mobile data offloading is the ever growing smart phone market giving people the option of streaming any content of the internet right on to the palm of their hands.

    Surprisingly it is not “work on the move” that is making a large percentage of the populace download content through their smart phones extensively but the driving factor happens to be  streaming of video content from sites such as YouTube that ranks at the top of data usage .

    Key industries can’t afford to ignore the trend especially when recent industry research predicts that nearly 50-60% of the data would be offloaded by the year 2017 by either WiFi, WiMax or Small cells with WiFi being a major player over the latter two.

    Why offload with begin with?

    At a time when cellular operator costs are going up due to investments in 3G and 4G network evolution, WiFi still ranks at the top for data offloading primarily due to 3G/4G pricing, poor signal reception indoors and WiFi’s higher bandwidths offerings with little or no interference.

    The three factors put together are the leading cause for smart phone / tablet data usage being offloaded to a WiFi network.

    A simple iPad sales figures of 2012 provides a interesting insight into the fact that 9 out of 10 iPads are only WiFi show casing a interesting find that cellular data services has been given a miss at the highly sought iPad retail market itself

    “A little known fact is that contrary to popular belief a smart phone / tablet also uses lesser battery when connected to a WiFi network accounted due to the lower signal strength requirement.”

    The benefactors

    Apart from the end users who get excellent bandwidth, speed and zero interference reception; the businesses which provide broadband services to end users cash in by filling in the gaps between the cell towers, literally.

    A few OPCOs in the wireless business who also double up by providing broadband services in the form of ADSL or FOC loop back their users into their network business.

    How can RA help?

    Analytics, analytics, analytics!!!

    “The true potential of analytics is only limited by ones own imagination of what can be done with an array of data at your disposal”

    Here RA’s primary role comes in as a revenue enhancer or opportunity loss identifier and not as the more commonly known roles of “leakage identification”.

    From an RA perspective looping in key information of users such as the data usage pattern over cellular and WiFi and overlaying them over various dimensions of demographics, content, customer categorization and lifestyle components will provide an insight on potential cellular onload or offload opportunities which can be monetized by provision value add or add on services to potential users.

    From an operators perspective this insight can increase revenues especially in regions where a good smart phone markets show below par cellular data usage therein operators can increasing their service offerings to targeted localities and users in the form small cells, WiFi, or  WiMax.