Category: Augmented Analytics

  • Top 7 AI and Data Analytics Trends to look forward in 2022

    There’s no doubt that AI and analytics are already changing how businesses operate across different industries- whether through task automation, insight generation, or other use cases. In 2022, it will continue to transform the enterprises in the way they live and work, and leaders will shift their focus to adopting AI solutions that are more sustainable and scalable.

    What 2022 is going to look like for AI and Data Analytics?

    In 2021, many enterprises saw the adoption of AI in at least one function across major industries. According to McKinsey Global Survey 2021, 57 percent of respondents report AI adoption, up from 45 percent in 2020.

    In 2022, preparation is the key to AI and Analytics success. It may be tempting to push AI into legacy environments as quickly as possible; it would be wiser to adopt a more careful and thoughtful approach. AI is only as good as the data it can access, so shoring up both infrastructure and data management and preparation processes will play a substantial role in adopting future AI-driven initiatives.

    From a technology perspective, there are many discussions around low-code/no-code AI platforms and architectural approaches to analytics, like Data Fabric, composable data, and analytics, workforce augmentation, etc. Let’s look at some interesting statistics for this year.

    Data analysis

    Top AI and Data Analytics trends to keep you on the radar

    Many new developments and breakthroughs will continue to push the boundaries of what’s possible. Here are the key areas where those breakthroughs will occur in 2022:

    #1 Data Fabric will be a key foundation for the enterprise to establish a frictionless data journey

    As the data increases in volume and becomes increasingly complex, and digital business accelerates, data fabric creates an agile and data-centric environment that responds quickly to the fast pace of change. According to Gartner, the data fabric concept enables frictionless access to and sharing data in a distributed data environment. It consists of end-to-end data integration and management solution that unlocks the potential of the data and reduces data to insights journey from any environment- cloud, on-premises, or edge. It reduces the time for integration for design by 30%, deployment by 30%, and maintenance by 70% because the technology designs draw on the ability to use/reuse and combine different data integration styles.

    #2 Composable data and analytics fosters agility

    Enterprises have more than one standard tool for analytics and BI. So, introducing new technology or tool becomes a costly affair. Composable data and analytics use/reuse components from multiple data, analytics, and AI solutions to reduce costs, boost deployment speed, and encourage collaboration. It uses AI across business intelligence, data management, and predictive analytics, evolving the analytics capabilities of an organization and enabling leaders to connect data insights to business actions.

    #3 Improved decision intelligence for enterprise-wide decision support

    Decision intelligence uses emerging technologies such as AI/ML to process large amounts of data to quickly extract meaningful insights for enterprises needed to drive actions for the business. In 2022, decision intelligence has the potential to make assessments not only better, but also faster, given that machine-generated decisions can be processed at speeds that humans cannot achieve.

    #4 Rise of Low-code and No-code technologies

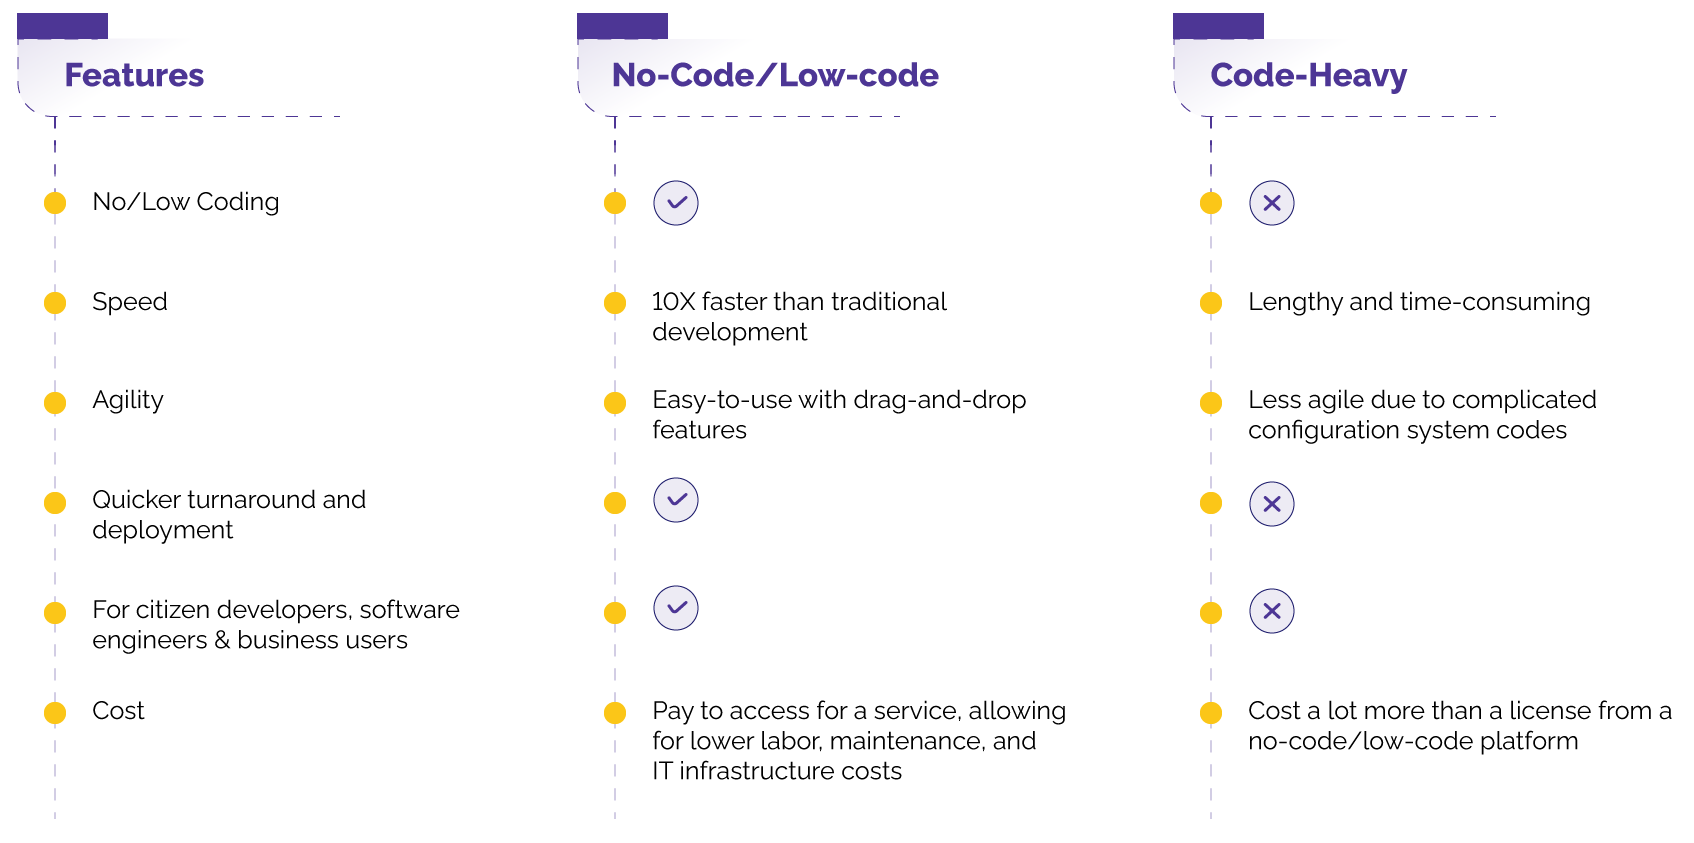
    According to Gartner, by 2023, over 50% of medium to large enterprises will have adopted low-code or no-code as one of their strategic application platforms. Also, it predicts that low-code platforms will be responsible for more than 65% of application development activity by 2024. The low-code and no-code technologies enable businesses to keep up with the rapidly changing technology landscape through innovation and by empowering business users and technical programmers to build applications with little to no coding.

    No-code/Low-code vs. Code-Heavy: What’s the difference?

    Data analysis

    #5 Ethical AI and Ethical Data Analytics become tangible

    As enterprises power AI advancements, the lack of governmental oversights has pushed the debate over the ethics of responsible AI to the fore. In 2022, we will see how ethical AI and ethical data analytics will continue to play a significant part in the simulation of innovation and economic growth, since more organizations will realize the need for responsible tech. Fairness of algorithms and data transparency are issues that will need to be addressed in the coming years as AI adoption is more widespread than ever. It will hopefully work its way towards policymakers as well.

    #6 AI will evolve more rapidly, expanding and impacting every business process

    While in 2021, most of the enterprises were still in the proof-of-concept phase of AI. 2022 will see a shift towards AI-first approaches. AI applications will be at the forefront of enterprise strategies. As AI/ML models become the norm, companies will expand AI to become every part of the department and impact every business process.

    #7 AI will become more widespread and accessible

    Previously in 2021, only big players such as Amazon, Google, Microsoft, etc., had the deep pockets to make AI/ML models a reality. In 2022, there will be more off-the-shelf technology to make AI/ML models more accessible, like readily available functionality to make applications talk, convert speech to text, and other industry-specific use cases. Also, modern workplaces are evolving with AI getting incorporated into their processes. Humans and machines will work alongside each other for quicker results. This creates a great combination of human innovation and machine intelligence.

    In 2022, AI and data analytics will not only be more prevalent but will also be more strategic. It will continue to be used to achieve productivity gains. In the coming years, AI will also be used to rethink and redesign products, services, business models, and overall strategy.

    This year, the challenges of integrating, cleaning, and processing data will continue. However, at the same time, there will be a flood of more generic AI and data-analytics platforms that will help replace manual tasks, freeing up data scientists for strategic tasks. As today’s enterprises strive to be data-driven and demand that the data be most efficient to provide a better experience, more enabling technologies will be available to ease the transition and adoption of AI across the organization.

    Do you agree with the points discussed in the article? If yes, which of the trends do you plan to adopt in your organization? Feel free to let us know your thoughts and comments in the section below if we’ve missed any important points.

    Derive Maximum Value From Your AI Investments

    Request Demo

  • An Introduction to efficient Hypermeter optimization for XGBoost model using Optuna

    An Introduction to efficient Hypermeter optimization for XGBoost model using Optuna

    Efficient Hyperparam

    Introduction :

    Hyperparameter optimization is the science of tuning or choosing the best set of hyperparameters for a learning algorithm. A set of optimal hyperparameter has a big impact on the performance of any machine learning algorithm. It is one of the most time-consuming yet a crucial step in machine learning training pipeline.

    A Machine learning model has two types of tunable parameter :

    • Model parameters
    • Model hyperparameters

    Efficient Hyperparam

    Model parameters vs Model hyperparameters (source)

    Model parameters are learned during the training phase of a model or classifier. For example :

    • coefficients in logistic regression or liner regression
    • weights in an artificial neural network

    Model Hyperparameters are set by user before the model training phase. For example :

    • ‘c’ (regularization strength), ‘penalty’ and ‘solver’ in logistic regression
    • ‘learning rate’, ‘batch size’, ‘number of hidden layers’ etc. in an artificial neural network

    The choice of Machine learning model depends on the dataset, the task in hand i.e. prediction or classification. Each model has its own unique set of hyperparameter and the task of finding the best combination of these parameter is known as hyperparameter optimization.

    For solving hyperparameter optimization problem there are various methods are available. For example :

    • Grid Search
    • Random Search
    • Optuna
    • HyperOpt

    In this post, we will focus on Optuna library which has one of the most accurate and successful hyperparameter optimization strategy.

    Optuna :

    Optuna is an open source hyperparameter optimization (HPO) framework to automate search space of hyperparameter. For finding an optimal set of hyperparameters, Optuna uses Bayesian method. It supports various types of samplers listed below :

    • GridSampler(using grid search)
    • RandomSampler(using random sampling)
    • TPESampler (using Tree-structured Parzen Estimator algorithm)
    • CmaEsSampler ( using CMA-ES algorithm)

    Use of Optuna for hyperparameter optimization is explained using Credit Card Fraud Detection dataset on Kaggle. The problem statement is to classify a credit card transaction fraudulent or genuine(binary classification). This data contains only numerical input variables which are PCA transformation of original features. Due to confidentially issues, the original features and more background information about the data are not available.

    In this case, we have used only a subset of the dataset to speed up the training time and to ensure the two different classes reach a perfectly balance. Here, the sampling method used is TPESampler . A subset of a dataset is shown in the figure below :

    Efficient Hyperparam

    A subset of Credit Card Fraud Detection dataset

    Importing required packages :

    import optuna
    from optuna import Trial, visualization
    from optuna.samplers import TPESampler
    from xgboost import XGBClassifier

    Following are the main steps involved in HPO using Optuna for XGBoost model:

    1. Define Objective Function :
      The first important step is to define an objective function. The objective should be to return a real value which has to minimize or maximize. In our case, we will be training XGBoost model and using the cross-validation score for evaluation. We will be returning this cross-validation score from an objective function which has to be maximized.
    2. Define Hyperparameter Search Space :
      Optuna supports five kind of hyperparameters distribution, which are given as follows :
    • Integer parameter: A uniform distribution on integers.
      n_estimators = trial.suggest_int(‘n_estimators’,100,500)
    • Categorical parameter: A categorical distribution.
      criterion = trial.suggest_categorical(‘criterion’ ,[‘gini’, ‘entropy’])
    • Uniform parameter: A uniform distribution in linear domain.
      subsample = trial.suggest_uniform(‘subsample’ ,0.2,0.8)
    • Discrete-uniform parameter: A discretized uniform distribution in linear domain.
      max_features = trial.suggest_discrete_uniform(‘max_features’, 0.05,1,0.05)
    • Loguniform parameter: A uniform distribution in log domain.
      learning_rate = trial.sugget_loguniform(‘learning_rate’ : 1e-6, 1e-3)

    The below figure shows the objective function and hyperparameter for our example.

    Objective Function

    1. Study Objective :
      We have to understand some important terminologies mentioned in their docs, which will make our work easier. These are given as follows :
    • Trial : A single call of the objective function
    • Study : An optimization session, which is a set of trails
    • Parameter : A variable whose value is to be optimized such as value of “n_estimators”

    The Study object is used to manage optimization process. Method create_study() returns a study object. A study object has useful properties for analyzing the optimization outcome. In method of create_study(), we have to define the direction of objective function i.e. “maximize” or “minimize” and sampler for example TPESampler(). After creating study, we can call Optimize().

    1. Best Trial and Result :
      Once the optimization process completed then we can obtain the best parameters value and the optimal value of the objective function.

    Best trial: score 0.9427118644067797,
    params {‘n_estimators’: 396, ‘max_depth’: 6, ‘reg_alpha’: 3, ‘reg_lambda’: 3, ‘min_child_weight’: 2, ‘gamma’: 0, ‘learning_rate’: 0.09041583301198859, ‘colsample_bytree’: 0.45999999999999996}

    1. Trail History :
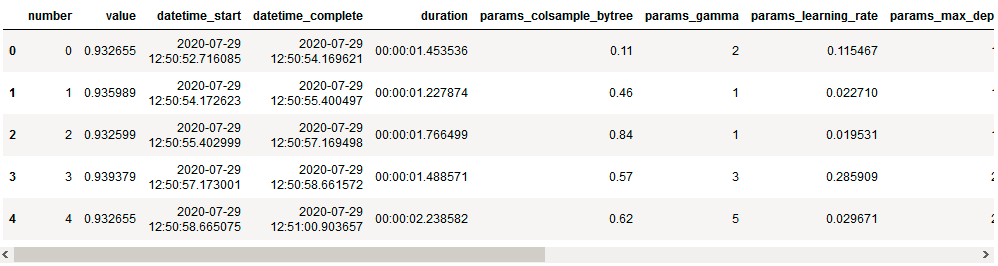
      We can get the entire history of all the trial in the form data frame by just calling study.trails_dataframe().

    Efficient Hyperparam

    1. Visualizations :

    Efficient Hyperparam

    Photo by Isaac Smith on Unsplash

    Visualizing the hyperparameter search space can be very useful. From the visualization, we can gain some useful information on the interaction between parameters and we can see where to search next. The optuna.visualization module includes a set of useful visualizations.

    i) plot_optimization_history(study): plots optimization history of all trials as well as the best score at each point.

    Efficient Hyperparam

    Optimization History Plot

    ii) plot_slice(study): plots the parameter relationship as slice also we can see which part of search space were explored more.

    Efficient Hyperparam

    Slice Plot

    iii) plot_parallel_coordinate(study) : plots the interactive visualization of the high-dimensional parameter relationship in study and scores.

    Efficient Hyperparam

    Parallel Coordinate Plot

    iv) plot_contor(study): plots parameter interactive chart from we can choose which hyperparameter space has to explore.

    Efficient Hyperparam

    Contour Plot

    Overall, Visualizations are Amazing in Optuna !!

    Want to see AI/ML models in action?

    Build your first AI model for Free with our 14-day free trial of HyperSense AI studio

    Get Free Trial

  • Clustering Algorithms Part 1

    Clustering Algorithms Part 1

    To understand clustering, we need to have a basic knowledge of Machine Learning. Machine learning is a subset of Artificial Intelligence that allows a machine to automatically learn from past data without programming explicitly. Classical machine learning is often categorized by how an algorithm learns to become more accurate in its predictions. There are four basic approaches: supervised learning, unsupervised learning, semi-supervised learning, and reinforcement learning. The type of algorithm that data scientists choose to use depends on what type of data they want to predict. Supervised learning is a machine learning approach that’s defined by its use of labelled datasets. These datasets are designed to train or “supervise” algorithms into classifying data or predicting outcomes accurately. Unsupervised learning on the other hand deals with unlabelled datasets. Clustering is an application of unsupervised learning. Semi-supervised learning is a branch of machine learning that attempts to solve problems that require or include both labelled and unlabelled data. Semi-supervised learning employs concepts of mathematics such as characteristics of both clustering and classification methods. Reinforcement learning is a kind of Machine Learning where in the system that is to be trained to do a particular job, learns on its own based on its previous experiences and outcomes while doing a similar kind of a job.

    What is Clustering and How it Works?

    Clustering is the task of dividing the population or data points into several groups such that data points in the same groups are similar to other data points in that group and dissimilar to the data points in other groups. It is basically an assembly of objects based on similarity and dissimilarity between them.

    clustering blog image

    The Importance of Clustering

    Clustering helps in understanding the natural grouping in a dataset. Their motivation is to check out to parcel the information into some gathering of legitimate groupings. Grouping quality relies upon the strategies and the identification of hidden patterns. The biggest advantage of clustering over-classification is it can adapt to the changes made and helps single out useful features that differentiate different groups.

    The Usage of Clustering Algorithms in Real World

    It is widely used in many applications such as image processing, data analysis, and pattern recognition.

    It can be used in the field of biology, by deriving animal and plant taxonomies, identifying genes with the same capabilities.

    It also helps in information discovery by classifying documents on the web.

    It helps marketers to find the distinct groups in their customer base and they can characterize their customer groups by using purchasing patterns.

    Different Types of Clustering Methods

    Connectivity-based Clustering (Hierarchical clustering)

    Hierarchical Clustering is a method of unsupervised machine learning clustering where it begins with a pre-defined top to bottom hierarchy of clusters. It then proceeds to perform a decomposition of the data objects based on this hierarchy, hence obtaining the clusters

    Centroids-based Clustering (Partitioning methods) 

    Centroid based clustering is considered as one of the simplest clustering algorithms, yet the most effective way of creating clusters and assigning data points to it. The intuition behind centroid-based clustering is that a cluster is characterized and represented by a central vector and data points that are in close proximity to these vectors are assigned to the respective clusters.

    Distribution-based Clustering

    Distribution-based clustering creates, and groups data points based on their likely hood of belonging to the same probability distribution in the data

    Density-based Clustering (Model-based methods)

    Density-based clustering methods take density into consideration instead of distances. Clusters are considered as the densest region in a data space, which is separated by regions of lower object density, and it is defined as a maximal set of connected points.

    Fuzzy Clustering

    The general idea about clustering revolves around assigning data points to mutually exclusive clusters, meaning, a data point always resides uniquely inside a cluster, and it cannot belong to more than one cluster. Fuzzy clustering methods change this paradigm by assigning a data-point to multiple clusters with a quantified degree of belongingness metric.

    Constraint-based (Supervised Clustering)

    The clustering process, in general, is based on the approach that the data can be divided into an optimal number of “unknown” groups. The underlying stages of all the clustering algorithms to find those hidden patterns and similarities, without any intervention or predefined conditions

    If you are working with ML algorithms, chances are you will be widely using Clustering. Clustering is an incredibly useful unsupervised machine learning method that has a wide variety of applications.

    Get ahead with MLOps. Get better, faster results from your data.

    Try HyperSense AI Studio for Free

  • Introduction to clustering in data science

    To understand clustering, we need to have a basic knowledge of Machine Learning. Machine learning is a subset of Artificial Intelligence that allows a machine to automatically learn from past data without programming explicitly. Classical machine learning is often categorized by how an algorithm learns to become more accurate in its predictions. There are four basic approaches: supervised learning, unsupervised learning, semi-supervised learning, and reinforcement learning. The type of algorithm that data scientists choose to use depends on what type of data they want to predict. Supervised learning is a machine learning approach that’s defined by its use of labelled datasets. These datasets are designed to train or “supervise” algorithms into classifying data or predicting outcomes accurately. Unsupervised learning on the other hand deals with unlabelled datasets. Clustering is an application of unsupervised learning. Semi-supervised learning is a branch of machine learning that attempts to solve problems that require or include both labelled and unlabelled data. Semi-supervised learning employs concepts of mathematics such as characteristics of both clustering and classification methods. Reinforcement learning is a kind of Machine Learning where in the system that is to be trained to do a particular job, learns on its own based on its previous experiences and outcomes while doing a similar kind of a job.

    What is Clustering and How it Works?

    Clustering is the task of dividing the population or data points into several groups such that data points in the same groups are similar to other data points in that group and dissimilar to the data points in other groups. It is basically an assembly of objects based on similarity and dissimilarity between them.

    clustering blog image

    The Importance of Clustering

    Clustering helps in understanding the natural grouping in a dataset. Their motivation is to check out to parcel the information into some gathering of legitimate groupings. Grouping quality relies upon the strategies and the identification of hidden patterns. The biggest advantage of clustering over-classification is it can adapt to the changes made and helps single out useful features that differentiate different groups.

    The Usage of Clustering Algorithms in Real World

    It is widely used in many applications such as image processing, data analysis, and pattern recognition.

    It can be used in the field of biology, by deriving animal and plant taxonomies, identifying genes with the same capabilities.

    It also helps in information discovery by classifying documents on the web.

    It helps marketers to find the distinct groups in their customer base and they can characterize their customer groups by using purchasing patterns.

    Different Types of Clustering Methods

    Connectivity-based Clustering (Hierarchical clustering)

    Hierarchical Clustering is a method of unsupervised machine learning clustering where it begins with a pre-defined top to bottom hierarchy of clusters. It then proceeds to perform a decomposition of the data objects based on this hierarchy, hence obtaining the clusters

    Centroids-based Clustering (Partitioning methods) 

    Centroid based clustering is considered as one of the simplest clustering algorithms, yet the most effective way of creating clusters and assigning data points to it. The intuition behind centroid-based clustering is that a cluster is characterized and represented by a central vector and data points that are in close proximity to these vectors are assigned to the respective clusters.

    Distribution-based Clustering

    Distribution-based clustering creates, and groups data points based on their likely hood of belonging to the same probability distribution in the data

    Density-based Clustering (Model-based methods)

    Density-based clustering methods take density into consideration instead of distances. Clusters are considered as the densest region in a data space, which is separated by regions of lower object density, and it is defined as a maximal set of connected points.

    Fuzzy Clustering

    The general idea about clustering revolves around assigning data points to mutually exclusive clusters, meaning, a data point always resides uniquely inside a cluster, and it cannot belong to more than one cluster. Fuzzy clustering methods change this paradigm by assigning a data-point to multiple clusters with a quantified degree of belongingness metric.

    Constraint-based (Supervised Clustering)

    The clustering process, in general, is based on the approach that the data can be divided into an optimal number of “unknown” groups. The underlying stages of all the clustering algorithms to find those hidden patterns and similarities, without any intervention or predefined conditions

    If you are working with ML algorithms, chances are you will be widely using Clustering. Clustering is an incredibly useful unsupervised machine learning method that has a wide variety of applications.

    Get ahead with MLOps. Get better, faster results from your data.

    Try HyperSense AI Studio for Free

  • Overview of Tree-based Algorithms in under 10 Minutes

    Overview of Tree-based Algorithms in under 10 Minutes

    Machine learning is not all about AI, but it is a big part of it.

    Machine Learning has emerged as a new way of communicating your wishes to a computer. It’s exciting because it allows you to automate the ineffable. Machine learning is powering most of the recent advancements in AI, including Computer Vision, NLP (Natural Language Processing), Predictive Analytics, Chatbots, and a wide range of applications. To move up the data value chain from the information level to the knowledge level, we need to apply machine learning that will enable systems to identify patterns in data and learn from those patterns to apply to new, never-seen data.

    Difference between Supervised Learning, Unsupervised Learning, and Semi-Supervised Learning

    Machine Learning use cases primarily fall into 3 categories: Supervised Learning, Unsupervised Learning, and Semi-Supervised Learning.

    1) Supervised Learning

    In the Supervised Learning use case, we have a known set of input data and the corresponding set of responses for it. The aim is to build a model which aims to learn the patterns and relationships between different input features (called as training phase) to generate a reasonable prediction as a response to the new input data (called as testing phase). Most of the real-world problems at scale, addressed by different organizations, fall in this category.

    2) Unsupervised Learning

    Unlike the Supervised Learning use case, Unsupervised learning involves finding inferences and hidden patterns from input data without references to any labeled responses or outcomes. This ability to discover patterns in information makes it an ideal solution for Cross-Selling strategies, Customer Segmentation, Image and Pattern recognition.

    3) Semi-Supervised Learning

    Semi-Supervised Learning, on the other hand, offers solutions that use the best of both worlds: Supervised and Unsupervised Learning. This approach is mostly adopted when there is an absence of good quantity or quality input data with labeled outcomes to train a supervised learning model. The smaller labeled data set is used to identify hidden patterns and the larger unlabelled dataset is used to extract features to improve upon the lack of quantity of labeled dataset.

    What are Tree-based Algorithms?

    Tree-based algorithms are one of the best and most used supervised learning methods, this is mainly due to the reason that these predictive models offer high accuracy, stability, and ease of interpretation as they map non-linear relationships quite well. This series is a journey designed to help readers not only to get a peek under the hood of popularly used state of the art tree-based algorithms but also to help readers to reach a level of proficiency so that one can make a better choice at adopting them to solve the problem statement at hand. This blog specifically provides an overview of the following Tree-Based Algorithms, which are popularly used in the ML community:

    1. Decision Trees
    2. Random Forests
    3. Gradient Boosting Machines
    4. XGBoost
    5. LightGBM
    6. CatBoost

    1) Understanding Decision Trees

    Decision Trees are one of the simplest and intuitive ways of predictive modeling. As the name suggests, we construct a tree-like model of decisions. It’s a flowchart-like structure that performs several tests on different features of the data point. Based on the tests, the data point will either be assigned to a class or a continuous value outcome. That is to say, Decision Trees can be used both for Classification and Regression use cases.

    But how are Decision Trees constructed, in the first place? There are various algorithmic approaches to construct a decision tree-like ID3, C4.5, CART, etc. The main parameter which separates these different algorithms is the Splitting Criterion which is used while selecting the decision nodes of the Tree. The splitting criterion helps in deciding which feature to use and the threshold value to perform the decision-making.

    We want the Decision Tree Model to be small and generalized to the training set, hence the main intent while performing the splits using Decision Nodes is to obtain the purest child nodes. It’s the different ways of measuring this purity which has let us come up with different splitting criterion.

    Information Gain is one such criterion. For each node of the tree, we measure how much information the feature gives us about the class. The split with the highest information gain will be taken first and the process continues until all the child nodes are pure, or the information gain is 0. Information Gain is calculated by measuring the difference between the entropy of the original dataset before and after the split. ID3 uses information gained for constructing the decision trees.

    Decision Trees essentially combine complex rules to give the correct predictions, because of this design, it is prone to Overfitting. In other words, A small change in the training set can cause a large change in the structure of the decision tree causing instability. In Addition, using a Decision Tree is relatively expensive, compared to other tree-based models, when training a large dataset.

    Hence, a Decision Tree becomes a good choice when we have a small to medium-sized dataset and model interpretability is required. In other cases, it proves to be inefficient and hence other tree-based algorithms are preferred which we will explore in the next section.

    2) Understanding Random Forest

    Random Forest is essentially inspired to solve the overfitting problems in Decision Trees. As the name suggests, this model consists of many individual Decision Trees whose predictions are aggregated (Averaging in case of Regression and Max Voting in case of Classification).

    The idea behind aggregating the prediction is quite simple, it is based on the Wisdom of Crowds. It says that A large crowd with uncorrelated opinions combined provides more wisdom than an individual opinion. In Data Science terminology, A large number of relatively uncorrelated models operation as a group will outperform any individual constituents. Uncorrelated models protect from propagating the errors of the base model. While some trees might be wrong, other trees might be correct, and overall as a group, they learn the correct patterns from the data instead of overfitting like a decision tree.

    But how does the Random Forest Ensure to train individual decision trees which are uncorrelated? A simple answer to this would be, to supply different samples of data to each Decision Tree and grow each Decision Tree using a specific subset of features. This technique to randomly sample with replacement to build individual trees is also known as Bootstrap Aggregation or Bagging. Bagging in combination with Feature Randomness ensures that each tree is trained on different data and a different subset of features, ensuring that results are uncorrelated.

    Although Random Forest was successful in mitigating the overfitting problem (or High Variance issue) in Decision Trees it is at a cost of increased compute and resources. Since multiple Decision Trees need to be built and maintained for predictions, it tends to take longer time, higher compute, larger resources, and lacks interpretability because of the ensemble nature. Despite these drawbacks, the model’s efficiency in giving correct predictions and ability to be used both for Regression and Classification problems has led to it being a popular algorithm that is used across multiple domains.

    3) Understanding Gradient Boosting Machines

    To understand GBM, we first need to touch upon the concept of Boosting. Unlike Bagging, where predictions of base models are aggregated to come up with a final prediction, Boosting focuses on building a strong learner by iteratively or sequentially learning patterns from the data using a consecutive chain of weak learners. Each tree, in this chain, focuses on correcting the net error generated from the previous tree. The first tree is built on the features with the highest predictive power which then passes on the predictions and error (difference between the actual and prediction) as an input to subsequent tree along with a weight parameter. The weights are used to control the second tree to utilize only those features which will fine-tune the combined predictions of the first and second tree to be close to the target as much as possible. The final prediction of the GBM is the weighted sum of all the individual predictions.

    Now that we know how Boosting works, the question arises on how we come up with the optimal weights to be assigned to the predictions of the individual weak learner. This is where the Gradient Descent Algorithm comes in place. In the context of GBM, we want to build an additive model, wherein Trees are added one at a time while existing trees in the model are not changed. Gradient Descent aims to add trees that reduce the loss function (and follow the gradient). The weights assigned to each tree are updated to minimize the error. We can limit the number of trees to be added by fixing a number or acceptable threshold of the loss function to stop the training.

    Because of this design, Gradient Boosting is a Greedy Algorithm and hence will keep on improving to minimize all errors leading to overfitting. Additionally, because trees must be trained sequentially it is computationally expensive and memory exhaustive for a larger dataset. That said, GBM is great at handling complex, non-linear relationships and are more powerful and accurate as compared to Random Forest or Decision Trees. In addition, Data Pre-processing steps to be done before using GBM are minimal, as it Handles the Missing Data and works great with Categorical Data as well.

    4) Understanding XGBoost

    XGBoost or Extreme Gradient Boosting is a modification of the GBM Architecture designed for Speed and Performance. It is an effort that is directed to push the limits of computations resources for boosted tree algorithms. Because of the Execution Speed and Model Performance, this is one of the go-to models in hackathons and has been recently dominating the applied machine learning community and Kaggle competitions which requires building ML models on structured or tabular data.

    But what makes XGBoost so special? It’s the System Optimization and Algorithmic Enhancements on top of the existing GBM framework, which makes it stands out from the rest ML algorithm. Firstly, XGBoost approaches the Sequential Tree Building using Parallelized implementation. In addition, it addresses the overfitting problem in GBM by using the “depth-first” approach to pruning trees backward which adds to the computational performance. Secondly, The library is designed with cache awareness and out-of-core computing which optimizes the disk space while handling large datasets. Lastly, The Algorithmic Enhancements such as built-in Cross-Validation, Sparsity Awareness, and Regularization make it robust and enable it to deliver good model performance.

    5) Understanding LightGBM

    Like XGBoost, this is an open-source library that provides more efficient and effective implementation of the Gradient Boosting Algorithm. This Tree-Based model can be used both for Classification and Regression. This extends the idea of GBM by adding in a type of Auto Feature Selection as well as focusing on data points with large gradients. This results in a dramatic speed-up of training (Hence, it is called a lighter version of GBM) and predictive performance.

    The high efficiency in terms of computing and high model performance can be attributed to two novel techniques GOSS or Gradient-Based One-Side Sampling and EFB or Exclusive Feature Bundling. GOSS is a modification of the Gradient Boosting method which gives more weightage to those examples which results in a larger gradient, which speeds up the learning process. EFB is an approach to bundle sparse (mostly zero) categorical features which have been one-hot encoded, thus acting as an Automatic Feature selection method.

    But how does it compare against XGBoost? LightGBM has many of the XGBoost’s advantages such as Sparse Optimization, Parallel Training, Regularization, Early Stopping, etc. But a major difference lies in the way the trees are constructed. Light GBM grows trees Leaf-wise, unlike other Tree Ensemble methods which grow trees level-wise row by row. The leaf which leads to the largest decrease in loss is selected and a Tree is grown from the output of that Leaf.

    Although it’s not fair to compare LightGBM and XGBoost, prior works which tried to benchmark the optimizations in these modified versions of GBM suggest XGBoost as a powerful algorithm that reduces the maximum training time ( when used on a GPU). It was also seen that LightGBM is not fast enough to converge to a good set of hyperparameters, as compared to XGBoost. That said, both these algorithms enjoy a fair bit of popularity in the ML community when it comes to Hackathons and working on use cases with a large dataset.

    6) Understanding CatBoost

    The name CatBoost comes from two words “Category” and “Boosting”. CatBoost is an open-source machine learning algorithm developed by Yandex. This algorithm is built on top of a Gradient Boosting Architecture, wherein consecutive trees are spawned to decrease the net error in prediction, the only difference being CatBoost uses oblivious decision trees to grow a balanced tree. That is to say that it uses the same features to make left and right splits for each level of the tree. This design helps in more efficient usage of CPU, in turn reducing the training time.

    One of the key highlights of this algorithm is the ease of dealing with categorical features in the dataset. Almost all the ML models which have been built require all the training data to be numeric. That means, if we have a categorical feature, we will have to employ Label Encoding or One Hot Encoding technique, else it would fail during the model building stage. CatBoost, on the other hand, doesn’t require explicit pre-processing to convert the categories, instead it internally uses various statistical measures to combine different categorical features and numerical features to achieve the same. It is also important to note that providing One Hot Encoded inputs to CatBoost models can decrease its efficiency in terms of model performance.

    As far as the performance is concerned, this model provides state-of-the-art results and stands in the same league as other Boosting Algorithms like XGBoost, LGBM, etc. The ease of use and the robustness towards overfitting leads to building a more generalized model which performs well for both regression and classification problems.

    Conclusion

    I hope by now, you have developed a fair bit of understanding about the evolution of Tree-Based Algorithms in the Machine Learning Landscape along with the key features which differentiate each of them. Stay tuned for more such “under 10 minutes” series of blogs, in the same space, where we will delve deeper into each of the algorithms with an ML use case to understand the intricacies to be taken care of while using them.

    Build machine learning models within minutes

    Claim your free trial now

  • Overview of Tree-based Algorithms in under 10 Minutes

    Machine learning is not all about AI, but it is a big part of it.

    Machine Learning has emerged as a new way of communicating your wishes to a computer. It’s exciting because it allows you to automate the ineffable. Machine learning is powering most of the recent advancements in AI, including Computer Vision, NLP (Natural Language Processing), Predictive Analytics, Chatbots, and a wide range of applications. To move up the data value chain from the information level to the knowledge level, we need to apply machine learning that will enable systems to identify patterns in data and learn from those patterns to apply to new, never-seen data.

    Difference between Supervised Learning, Unsupervised Learning, and Semi-Supervised Learning

    Machine Learning use cases primarily fall into 3 categories: Supervised Learning, Unsupervised Learning, and Semi-Supervised Learning.

    1) Supervised Learning

    In the Supervised Learning use case, we have a known set of input data and the corresponding set of responses for it. The aim is to build a model which aims to learn the patterns and relationships between different input features (called as training phase) to generate a reasonable prediction as a response to the new input data (called as testing phase). Most of the real-world problems at scale, addressed by different organizations, fall in this category.

    2) Unsupervised Learning

    Unlike the Supervised Learning use case, Unsupervised learning involves finding inferences and hidden patterns from input data without references to any labeled responses or outcomes. This ability to discover patterns in information makes it an ideal solution for Cross-Selling strategies, Customer Segmentation, Image and Pattern recognition.

    3) Semi-Supervised Learning

    Semi-Supervised Learning, on the other hand, offers solutions that use the best of both worlds: Supervised and Unsupervised Learning. This approach is mostly adopted when there is an absence of good quantity or quality input data with labeled outcomes to train a supervised learning model. The smaller labeled data set is used to identify hidden patterns and the larger unlabelled dataset is used to extract features to improve upon the lack of quantity of labeled dataset.

    What are Tree-based Algorithms?

    Tree-based algorithms are one of the best and most used supervised learning methods, this is mainly due to the reason that these predictive models offer high accuracy, stability, and ease of interpretation as they map non-linear relationships quite well. This series is a journey designed to help readers not only to get a peek under the hood of popularly used state of the art tree-based algorithms but also to help readers to reach a level of proficiency so that one can make a better choice at adopting them to solve the problem statement at hand. This blog specifically provides an overview of the following Tree-Based Algorithms, which are popularly used in the ML community:

    1. Decision Trees
    2. Random Forests
    3. Gradient Boosting Machines
    4. XGBoost
    5. LightGBM
    6. CatBoost

    1) Understanding Decision Trees

    Decision Trees are one of the simplest and intuitive ways of predictive modeling. As the name suggests, we construct a tree-like model of decisions. It’s a flowchart-like structure that performs several tests on different features of the data point. Based on the tests, the data point will either be assigned to a class or a continuous value outcome. That is to say, Decision Trees can be used both for Classification and Regression use cases.

    But how are Decision Trees constructed, in the first place? There are various algorithmic approaches to construct a decision tree-like ID3, C4.5, CART, etc. The main parameter which separates these different algorithms is the Splitting Criterion which is used while selecting the decision nodes of the Tree. The splitting criterion helps in deciding which feature to use and the threshold value to perform the decision-making.

    We want the Decision Tree Model to be small and generalized to the training set, hence the main intent while performing the splits using Decision Nodes is to obtain the purest child nodes. It’s the different ways of measuring this purity which has let us come up with different splitting criterion.

    Information Gain is one such criterion. For each node of the tree, we measure how much information the feature gives us about the class. The split with the highest information gain will be taken first and the process continues until all the child nodes are pure, or the information gain is 0. Information Gain is calculated by measuring the difference between the entropy of the original dataset before and after the split. ID3 uses information gained for constructing the decision trees.

    Decision Trees essentially combine complex rules to give the correct predictions, because of this design, it is prone to Overfitting. In other words, A small change in the training set can cause a large change in the structure of the decision tree causing instability. In Addition, using a Decision Tree is relatively expensive, compared to other tree-based models, when training a large dataset.

    Hence, a Decision Tree becomes a good choice when we have a small to medium-sized dataset and model interpretability is required. In other cases, it proves to be inefficient and hence other tree-based algorithms are preferred which we will explore in the next section.

    2) Understanding Random Forest

    Random Forest is essentially inspired to solve the overfitting problems in Decision Trees. As the name suggests, this model consists of many individual Decision Trees whose predictions are aggregated (Averaging in case of Regression and Max Voting in case of Classification).

    The idea behind aggregating the prediction is quite simple, it is based on the Wisdom of Crowds. It says that A large crowd with uncorrelated opinions combined provides more wisdom than an individual opinion. In Data Science terminology, A large number of relatively uncorrelated models operation as a group will outperform any individual constituents. Uncorrelated models protect from propagating the errors of the base model. While some trees might be wrong, other trees might be correct, and overall as a group, they learn the correct patterns from the data instead of overfitting like a decision tree.

    But how does the Random Forest Ensure to train individual decision trees which are uncorrelated? A simple answer to this would be, to supply different samples of data to each Decision Tree and grow each Decision Tree using a specific subset of features. This technique to randomly sample with replacement to build individual trees is also known as Bootstrap Aggregation or Bagging. Bagging in combination with Feature Randomness ensures that each tree is trained on different data and a different subset of features, ensuring that results are uncorrelated.

    Although Random Forest was successful in mitigating the overfitting problem (or High Variance issue) in Decision Trees it is at a cost of increased compute and resources. Since multiple Decision Trees need to be built and maintained for predictions, it tends to take longer time, higher compute, larger resources, and lacks interpretability because of the ensemble nature. Despite these drawbacks, the model’s efficiency in giving correct predictions and ability to be used both for Regression and Classification problems has led to it being a popular algorithm that is used across multiple domains.

    3) Understanding Gradient Boosting Machines

    To understand GBM, we first need to touch upon the concept of Boosting. Unlike Bagging, where predictions of base models are aggregated to come up with a final prediction, Boosting focuses on building a strong learner by iteratively or sequentially learning patterns from the data using a consecutive chain of weak learners. Each tree, in this chain, focuses on correcting the net error generated from the previous tree. The first tree is built on the features with the highest predictive power which then passes on the predictions and error (difference between the actual and prediction) as an input to subsequent tree along with a weight parameter. The weights are used to control the second tree to utilize only those features which will fine-tune the combined predictions of the first and second tree to be close to the target as much as possible. The final prediction of the GBM is the weighted sum of all the individual predictions.

    Now that we know how Boosting works, the question arises on how we come up with the optimal weights to be assigned to the predictions of the individual weak learner. This is where the Gradient Descent Algorithm comes in place. In the context of GBM, we want to build an additive model, wherein Trees are added one at a time while existing trees in the model are not changed. Gradient Descent aims to add trees that reduce the loss function (and follow the gradient). The weights assigned to each tree are updated to minimize the error. We can limit the number of trees to be added by fixing a number or acceptable threshold of the loss function to stop the training.

    Because of this design, Gradient Boosting is a Greedy Algorithm and hence will keep on improving to minimize all errors leading to overfitting. Additionally, because trees must be trained sequentially it is computationally expensive and memory exhaustive for a larger dataset. That said, GBM is great at handling complex, non-linear relationships and are more powerful and accurate as compared to Random Forest or Decision Trees. In addition, Data Pre-processing steps to be done before using GBM are minimal, as it Handles the Missing Data and works great with Categorical Data as well.

    4) Understanding XGBoost

    XGBoost or Extreme Gradient Boosting is a modification of the GBM Architecture designed for Speed and Performance. It is an effort that is directed to push the limits of computations resources for boosted tree algorithms. Because of the Execution Speed and Model Performance, this is one of the go-to models in hackathons and has been recently dominating the applied machine learning community and Kaggle competitions which requires building ML models on structured or tabular data.

    But what makes XGBoost so special? It’s the System Optimization and Algorithmic Enhancements on top of the existing GBM framework, which makes it stands out from the rest ML algorithm. Firstly, XGBoost approaches the Sequential Tree Building using Parallelized implementation. In addition, it addresses the overfitting problem in GBM by using the “depth-first” approach to pruning trees backward which adds to the computational performance. Secondly, The library is designed with cache awareness and out-of-core computing which optimizes the disk space while handling large datasets. Lastly, The Algorithmic Enhancements such as built-in Cross-Validation, Sparsity Awareness, and Regularization make it robust and enable it to deliver good model performance.

    5) Understanding LightGBM

    Like XGBoost, this is an open-source library that provides more efficient and effective implementation of the Gradient Boosting Algorithm. This Tree-Based model can be used both for Classification and Regression. This extends the idea of GBM by adding in a type of Auto Feature Selection as well as focusing on data points with large gradients. This results in a dramatic speed-up of training (Hence, it is called a lighter version of GBM) and predictive performance.

    The high efficiency in terms of computing and high model performance can be attributed to two novel techniques GOSS or Gradient-Based One-Side Sampling and EFB or Exclusive Feature Bundling. GOSS is a modification of the Gradient Boosting method which gives more weightage to those examples which results in a larger gradient, which speeds up the learning process. EFB is an approach to bundle sparse (mostly zero) categorical features which have been one-hot encoded, thus acting as an Automatic Feature selection method.

    But how does it compare against XGBoost? LightGBM has many of the XGBoost’s advantages such as Sparse Optimization, Parallel Training, Regularization, Early Stopping, etc. But a major difference lies in the way the trees are constructed. Light GBM grows trees Leaf-wise, unlike other Tree Ensemble methods which grow trees level-wise row by row. The leaf which leads to the largest decrease in loss is selected and a Tree is grown from the output of that Leaf.

    Although it’s not fair to compare LightGBM and XGBoost, prior works which tried to benchmark the optimizations in these modified versions of GBM suggest XGBoost as a powerful algorithm that reduces the maximum training time ( when used on a GPU). It was also seen that LightGBM is not fast enough to converge to a good set of hyperparameters, as compared to XGBoost. That said, both these algorithms enjoy a fair bit of popularity in the ML community when it comes to Hackathons and working on use cases with a large dataset.

    6) Understanding CatBoost

    The name CatBoost comes from two words “Category” and “Boosting”. CatBoost is an open-source machine learning algorithm developed by Yandex. This algorithm is built on top of a Gradient Boosting Architecture, wherein consecutive trees are spawned to decrease the net error in prediction, the only difference being CatBoost uses oblivious decision trees to grow a balanced tree. That is to say that it uses the same features to make left and right splits for each level of the tree. This design helps in more efficient usage of CPU, in turn reducing the training time.

    One of the key highlights of this algorithm is the ease of dealing with categorical features in the dataset. Almost all the ML models which have been built require all the training data to be numeric. That means, if we have a categorical feature, we will have to employ Label Encoding or One Hot Encoding technique, else it would fail during the model building stage. CatBoost, on the other hand, doesn’t require explicit pre-processing to convert the categories, instead it internally uses various statistical measures to combine different categorical features and numerical features to achieve the same. It is also important to note that providing One Hot Encoded inputs to CatBoost models can decrease its efficiency in terms of model performance.

    As far as the performance is concerned, this model provides state-of-the-art results and stands in the same league as other Boosting Algorithms like XGBoost, LGBM, etc. The ease of use and the robustness towards overfitting leads to building a more generalized model which performs well for both regression and classification problems.

    Conclusion

    I hope by now, you have developed a fair bit of understanding about the evolution of Tree-Based Algorithms in the Machine Learning Landscape along with the key features which differentiate each of them. Stay tuned for more such “under 10 minutes” series of blogs, in the same space, where we will delve deeper into each of the algorithms with an ML use case to understand the intricacies to be taken care of while using them.

    Build machine learning models within minutes

    Claim your free trial now

  • How to choose an effective Business Intelligence platform?

    How to choose an effective Business Intelligence platform?

    Whether you want to integrate real-time analytics into an existing product or corporate site or re-invent your present internal reporting structure with modern analytics, choosing a Business Intelligence platform is a process not to be taken lightly. There’s a lot to think about, including the user experience, appearance and feel, vendor support, and whether or not the fundamental capabilities are sufficient. Also, the enormous time, money, and effort commitment! There are several possibilities when it comes to selecting a Business Intelligence platform. Due to the sheer number of players in the market and their seemingly indistinguishable products, purchasers find it more difficult than ever to assess comparisons between market alternatives appropriately. This option complexity tends to result in some erroneous decision-making.

    Need for BI platform

    First and foremost, determine why you require a BI platform. Are you seeking an internal solution that will enable your users to gain access to the data insights they require and assist them in making informed decisions? Are you looking for a solution for small teams or one that can scale across the organization? Or are you looking to integrate analytics into your customer-facing application(s) to gain a competitive advantage and provide real-time data to your clients? Many businesses are happy to use business intelligence as a stand-alone solution, internal portal, or data visualization tool. Others currently offer an application to their consumers, and a Business Intelligence platform would be a natural expansion of their service. It’s critical to pick a vendor whose BI product best matches your goals while assessing vendors. Although the differences are minor, you’ll be glad you chose a BI platform that specializes in your use case once you get started.

    There are many factors based on which you can choose a business intelligence platform for an organization. These are as follows:

    – Level of tech-savviness

    The majority of users will categorize themselves as Business Users, Analysts, or Developers. It’s critical to know your audience to ensure that they can interpret data in the way that best meets their requirements and abilities. However, we don’t propose isolating individuals whose user personas differ from the majority of your audience; it’s critical to choose a BI platform that caters to more than just analysts (for example). Make sure your BI platform shortlist includes one that offers an adaptive user experience or empowers any user by automatically customizing the user experience to the user’s abilities. In other words, a BI platform that gives you complete control over the entire BI process, allowing you to quickly modify it to your team’s or organization’s specific needs at scale.

    – Ask for a demo

    Requesting a demonstration of the platform’s capabilities is an excellent way to get your evaluation started. However, simply seeing a pre-recorded example or attending a group session isn’t enough. Find vendors that can customize the live demo using your actual, currently used data suppliers with whom you can have an open-ended, exciting discussion about your specific needs. Include everyone (and I mean everyone) who will play a role in determining which BI platform you will use in your final decision. It will help users and stakeholders from various parties guarantee that you’re all asking the same questions to fully comprehend how the data visualization software will satisfy your business needs.

    – Data Quality and Process

    The quality and amount of integration of their data warehouse and underlying ETL/ELT procedures is a hurdle many organizations face when evaluating their data. The centralized repository must be a data source that is unified, accessible, and correct. The most crucial stage in deploying business intelligence tools and analytics is ensuring that functional and operational data systems are trustworthy and dependable from the start.

    – Propel your BI strategy

    Even the most powerful business intelligence reporting technology is meaningless if it can’t connect to your data quickly. So you can get to your analysis faster if the analytics platform provides efficient native connectivity to your data, no matter where it lives. You should access and evaluate your data in real-time without downloading it. With little to no coding effort on your part, you should be able to query your databases quickly. Your BI platform should also give you the option of deploying your analytics in the cloud, in a hybrid environment, or on-premises. Instead of pushing you to modify or buy more products and upsetting your current data architecture, the platform should interact smoothly with your existing data strategy. It should also be simple to integrate with your company portals and other enterprise apps, allowing you to meet your customers where they are. Flexibility is crucial when selecting a Business Intelligence platform, and the total cost of ownership will be higher if the tools aren’t versatile.

    – Ease of use

    Everyone in your organization, regardless of skill level, should analyze their data and use those insights with the correct business intelligence platform. Platforms for BI should adapt to current technology and user innovation. You should select a platform that will scale as your business expands.

    Is your organization already using the BI platform? Or is it planning to buy a BI platform to make informed decisions? If yes, please tell me what factors you consider while choosing the BI platform. Let me know your thoughts in the comments section.

    A no-code software for business users to visualize, analyze, and share data insights.

    Try out for free now!

  • How to choose an effective Business Intelligence platform?

    Whether you want to integrate real-time analytics into an existing product or corporate site or re-invent your present internal reporting structure with modern analytics, choosing a Business Intelligence platform is a process not to be taken lightly. There’s a lot to think about, including the user experience, appearance and feel, vendor support, and whether or not the fundamental capabilities are sufficient. Also, the enormous time, money, and effort commitment! There are several possibilities when it comes to selecting a Business Intelligence platform. Due to the sheer number of players in the market and their seemingly indistinguishable products, purchasers find it more difficult than ever to assess comparisons between market alternatives appropriately. This option complexity tends to result in some erroneous decision-making.

    Need for BI platform

    First and foremost, determine why you require a BI platform. Are you seeking an internal solution that will enable your users to gain access to the data insights they require and assist them in making informed decisions? Are you looking for a solution for small teams or one that can scale across the organization? Or are you looking to integrate analytics into your customer-facing application(s) to gain a competitive advantage and provide real-time data to your clients? Many businesses are happy to use business intelligence as a stand-alone solution, internal portal, or data visualization tool. Others currently offer an application to their consumers, and a Business Intelligence platform would be a natural expansion of their service. It’s critical to pick a vendor whose BI product best matches your goals while assessing vendors. Although the differences are minor, you’ll be glad you chose a BI platform that specializes in your use case once you get started.

    There are many factors based on which you can choose a business intelligence platform for an organization. These are as follows:

    – Level of tech-savviness

    The majority of users will categorize themselves as Business Users, Analysts, or Developers. It’s critical to know your audience to ensure that they can interpret data in the way that best meets their requirements and abilities. However, we don’t propose isolating individuals whose user personas differ from the majority of your audience; it’s critical to choose a BI platform that caters to more than just analysts (for example). Make sure your BI platform shortlist includes one that offers an adaptive user experience or empowers any user by automatically customizing the user experience to the user’s abilities. In other words, a BI platform that gives you complete control over the entire BI process, allowing you to quickly modify it to your team’s or organization’s specific needs at scale.

    – Ask for a demo

    Requesting a demonstration of the platform’s capabilities is an excellent way to get your evaluation started. However, simply seeing a pre-recorded example or attending a group session isn’t enough. Find vendors that can customize the live demo using your actual, currently used data suppliers with whom you can have an open-ended, exciting discussion about your specific needs. Include everyone (and I mean everyone) who will play a role in determining which BI platform you will use in your final decision. It will help users and stakeholders from various parties guarantee that you’re all asking the same questions to fully comprehend how the data visualization software will satisfy your business needs.

    – Data Quality and Process

    The quality and amount of integration of their data warehouse and underlying ETL/ELT procedures is a hurdle many organizations face when evaluating their data. The centralized repository must be a data source that is unified, accessible, and correct. The most crucial stage in deploying business intelligence tools and analytics is ensuring that functional and operational data systems are trustworthy and dependable from the start.

    – Propel your BI strategy

    Even the most powerful business intelligence reporting technology is meaningless if it can’t connect to your data quickly. So you can get to your analysis faster if the analytics platform provides efficient native connectivity to your data, no matter where it lives. You should access and evaluate your data in real-time without downloading it. With little to no coding effort on your part, you should be able to query your databases quickly. Your BI platform should also give you the option of deploying your analytics in the cloud, in a hybrid environment, or on-premises. Instead of pushing you to modify or buy more products and upsetting your current data architecture, the platform should interact smoothly with your existing data strategy. It should also be simple to integrate with your company portals and other enterprise apps, allowing you to meet your customers where they are. Flexibility is crucial when selecting a Business Intelligence platform, and the total cost of ownership will be higher if the tools aren’t versatile.

    – Ease of use

    Everyone in your organization, regardless of skill level, should analyze their data and use those insights with the correct business intelligence platform. Platforms for BI should adapt to current technology and user innovation. You should select a platform that will scale as your business expands.

    Is your organization already using the BI platform? Or is it planning to buy a BI platform to make informed decisions? If yes, please tell me what factors you consider while choosing the BI platform. Let me know your thoughts in the comments section.

    A no-code software for business users to visualize, analyze, and share data insights.

    Try out for free now!

  • How to unlock business value from MLOps?

    How to unlock business value from MLOps?

    Introduction:
    According to Gartner, 85 percent of all Artificial Intelligence (AI) projects tend to fail and the trend is expected to run well through 2022. What are the key reasons for this high failure rate in AI projects? There are three key ones:

    1. Model deployment is not an easy tasks; it requires diverse expertise from software engineering, to machine learnings engineering along with data scientists
    2. Model performances or effectiveness deteriorate on real-world applications
    3. Models designed without collaboration between domain experts and engineers are unlikely to deliver the desired results

    However, organizations can flip the equation by adopting Machine Learning Operations or MLOps, which allows organizations to redefine a process of putting model into productions, helps break from the shackles of siloes and allows different teams to collaborate in real-time with a goal to serve model for business and help achieve ROI. MLOps also ensures that the ML models created through the process are scalable and can be redeployed to solving other problems.

    What is MLOps?

    Before DevOps, developers were spending hours and hours working on code that may never go into production. As a result, DevOps got its footing in the tech industry over a decade ago as a means to bring the development teams and the IT teams together and make these somewhat different communities collaborate in a frictionless manner. Before DevOps, developers were spending hours and hours working on code that may never go into production.However, by being able to collaborate with the IT teams, nearly all DevOps teams today are convinced about their code even before it goes into production.

    As AI and ML started to grow, they faced similar challenges that developers faced in the pre-DevOps era—getting stuck trying to take an AI project from ideation to production stage. And so, came Machine Learning Operations (MLOps). Modelled on the principles of DevOps, MLOps brings together people, processes, and practices by allowing collaboration between data, development and production teams.

    Underpinning the idea of MLOps are technologies that automate the deployment, monitoring, and management of machine learning models. MLOps, in fact, goes a step ahead and ensures that the code that goes into production is scalable and provides a measurable business while having a strong governance framework at the same time.
    What are the key components of MLOps?
    MLOps acts as a guiding principles for data scientists, engineers and operations professionals to collaborate and help manage the production ML lifecycle. MLOps leverages automation to improve the quality of production ML with a constant eye on business goals.

    Broadly, there are three key phases of any MLOps process—Designing the ML-powered application, ML Experimentation and Development, and finally, ML Operations.The design phase for the ML-powered application begins with understanding the business and the available data. Next, potential users need to be identified in this stage, and then an ML solution is designed to solve their problems while also looking at the possibilities of scaling the application to other areas. Typically, this phase looks at either enhancing user productivity or increasing the interactivity of the ML application.

    The design phase also clearly defines the ML use-cases and prioritizes them. The available data is inspected and used to train the ML model. The requirements gathered from this exercise are then used to design the architecture of the ML application, establish the serving strategy, and create a test suite for the future ML model.

    In the next phase of MLOps, it is vital to verify the applicability of ML for the identified problems through the deployment of an ML Model Proof-of-Concept. This phase is run iteratively to identify or polish the suitable ML algorithm for the given situation, data engineering, and model engineering. The idea is to build a stable quality ML model thatcan be runin production.

    The last and final phase of operations aims to deliver the previously developed ML model in production by using established DevOps practices such as testing, versioning, continuous delivery, and monitoring.

    The three phases are highly interconnected while also influencing each other. Each of these phases contributes key elements that work to close the ML lifecycle loop within an organization.
    What are the benefits of MLOps?
    MLOps can be highly beneficial for CXOs, data scientists, and data engineers alike. Let’s take for example on how MLOps can benefit CXOs. C-suite leaders require fast, accurate, and unbiased predictions. They are also looking for an AI solution that can provide them with a clear return on investment. That has been challenging for years but MLOps changes that forever by making it simple to highlight ROI on AI investments. By putting MLOps in place, CXOs can therefore utilize their energies into scaling AI capabilities throughout the organization while focusing on tracking KPIs that matter to each team and department.

    Data scientists can similarly gain immense benefits from MLOps as it automates several parts of their daily lives while also allowing them to effectively collaborate with their operations counterparts. MLOps also eases out data scientists and ML engineers’ efforts by offloading much of the burden of day to day model management. This allows them to focus on the larger problems such as identifying new use cases, managing feature discovery, and developing more in-depth business expertise. A large part of a data scientist’s time goes into maintaining models or reviewing their performance manually. All of that gets automated with MLOps and frees up valuable resources.

    For DevOps and data engineers, MLOps offers a way to manage their actual machine learning models in a single pane—right from testing and validation to updates and performance metrics. This enables the organization to scale ML deployment over a period of time to meet latency, throughput, and reliability SLAs, thereby generating more value from it.

    How to implement MLOps?

    Even before one thinks of implementing MLOps, it is important to start with a clear business goal or objective. These objectives need to be fleshed out with target performance measures, technical requirements, budget for the project, and KPIs that drive the process of monitoring the deployed models.

    Once that’s in place, MLOps can be implemented in three different ways, depending on the organization’s maturity level in terms of the understanding of MLOps. The three types of implementation include manual process, ML pipeline automation, and CI/CD pipeline automation. These are also commonly referred to as the three levels of MLOps—MLOps level 0 (manual process), MLOps level 1 (pipeline automation), and MLOps level 2 (CI/CD pipeline automation).

    Typically while starting their journey with ML, organizations begin with the manual ML workflow. In this type of deployment, every step of the journey is manual, including data analysis, data preparation, model training and even validation. In this type of implementation, data scientists work on the ML model and hand it over after training it to the engineering team to deploy on their API infrastructure.

    This type of deployment is suitable when the assumption is that your data science team manages a few models that don’t change frequently. And since there are no frequent changes, there is no need for Continuous Integration and Continuous Deployment.

    The second type of implementation is ML pipeline automation. This type of implementation goes a step ahead of the manual process and automates the ML pipeline to perform continuous training of the ML model. This type of implementation is suitable for solutions that operate in a constantly changing environment and need to proactively address shifts in indicators such as customer sentiment, market prices etc. While in MLOps level 0, the trained model is deployed as a prediction service to production, in level 1, an entire training pipeline is deployed that automatically and iteratively runs to serve the trained model as the prediction service.

    However, this model is still not suitable for new ML idea, rather only new models based on new data. Moreover, it is not ideal for environments where you need to manage multiple ML pipelines in production.

    To overcome the limitations of MLOps level 1, MLOps level 2 takes things up a notch and fits well with tech-driven companies that continuously retrain their ML models on a daily basis and redeploy the code on thousands of servers simultaneously.

    The automated CI/CD pipeline, data scientists can spend more time on high-value items such as feature engineering, model architecture and hyperparameters. The output of MLOps level 2 is a deployed model prediction service.

    The challenges to implementing MLOps

    In 2013, IBM partnered with The University of Texas MD Anderson Cancer Center to build Watson for Oncology with an aim to eradicate cancer. Five years down the line, the project was shelved as it started giving erroneous treatment advice. Later it is found that the ML model was trained not on real patient data but rather on a small number of hypothetic patients.

    Mistakes like these are pretty common in the ML domain. A typical ML lifecycle involves the identification of a business problem, establishing the success criteria, and then delivering an ML model to production. The delivery part happens in multiple steps, and each of these steps can either be performed manually or through an automatic pipeline.

    While it may sound prudent to focus on solving the business problem, it is easy to lose focus on the complexities in managing the entire ML process. ML is a highly iterative process, and data scientists end up spending a lot of time in these iterations. Forcing models into production after the first or the second iteration can quickly turn into a failed deployment.

    Data scientists need to not only deal with short response times but also support a large number of users. Moreover, working with thousands of code lines bring along their own set of difficulties to manage. Therefore, while data scientists were previously only required to produce an ML model, today, the first step is bringing ML models to production.

    Lack of synergies between data science and operations teams sometimes also becomes a big challenge for organizations. Often the data science teams don’t have enough process understanding, and operations teams end up overestimating their understanding of ML processes, leading to disastrous outcomes.

    MLOps requires dedicated people and resources to succeed. CXOs need to understand that MLOps is an iterative process and requires significant advance planning. The process cannot be taken casually, and companies need to be prepared for various contingencies.

    Lately, there are plathero of tools, frameworks and platforms available in the market to bring together highly disparate space of “model production management” into the center of AI ecosystem. These tools and frameworks are primarily focused technical engineers to centralize the orchestration of model production using principles of MLops.

    At the same time, while AI is going no-code and enabling business users or citizen data scientist to handle data science projects. It is equally important to domain users, analytic experts to enable their ML models build into production. Hence, there are no code MLOps platforms such as HyperSense AI studio. It is designed exclusively for domain and analytic experts to take chart of machine learning models and deploy and manage complete life-cycle of ML models.
    Tips to implement MLOps
    New age MLOps platforms have significantly reduced the management challenges faced by data scientists, allowing them to be more confident about their code going into production. HyperSense AI Studio is a great example of new-age MLOps. The platform enables any enterprise user to build and operationalize AI successfully using automated machine learning. It increases the efficiency of data scientists allowing them to focus on higher-value tasks. It automates every step of the data science lifecycle including, feature engineering, algorithm selection, and hyper-parameter tuning.

    By leveraging HyperSense AI Studio, data scientists and experts can easily and quickly build ML models with larger scale, productivity, and efficiency while sustaining the model quality. By automating a large part of the ML processes, the platform accelerates the time to get production-ready models with greater ease and efficiency. It also reduces human errors mainly because of manual measures in ML models. Further, HyperSense also makes data science accessible to all, enabling both trained and non-trained resources to rapidly build accurate and robust models, thus fostering a decentralized process.

    The quality of the machine learning model is not only based on code but also on the features used for running the model. Around 80% of data scientists’ time goes into creating, training, and testing data.

    HyperSense AI Studio comes built-in with a feature store that allows features to be registered, discovered, and used as a part of an ML pipeline. In addition, it enables reusing components instead of rebuilding again from scratch for different models driving AI at scale.

    HyperSense AI Studio increases the efficiency of data scientists by allowing them to focus on higher-value tasks. The platform also automates every step of the data science lifecycle including, feature engineering, algorithm selection, and hyper-parameter tuning.
    Key Takeaways
    Data scientists are a highly coveted lot. Yet, 80 percent of their time ends up being wasted doing repetitive tasks that can easily be automated. At the same time, the lack of synergies between data science and operations teams has led to a majority of AI projects to fail. This can be easily avoided.

    MLOps allows all the stakeholders in the ML process to work collaboratively and ensure the models they work on gets into production. New tools such as HyperSense AI that brings in automation and low code capabilities also bridge the data science skills gap to a large extent by freeing up nearly 70-80% of the time spent by data scientists on model testing and validation.

    Get ahead with HyperSense MLOps. Get better, faster business results

    Try AI Studio for Free
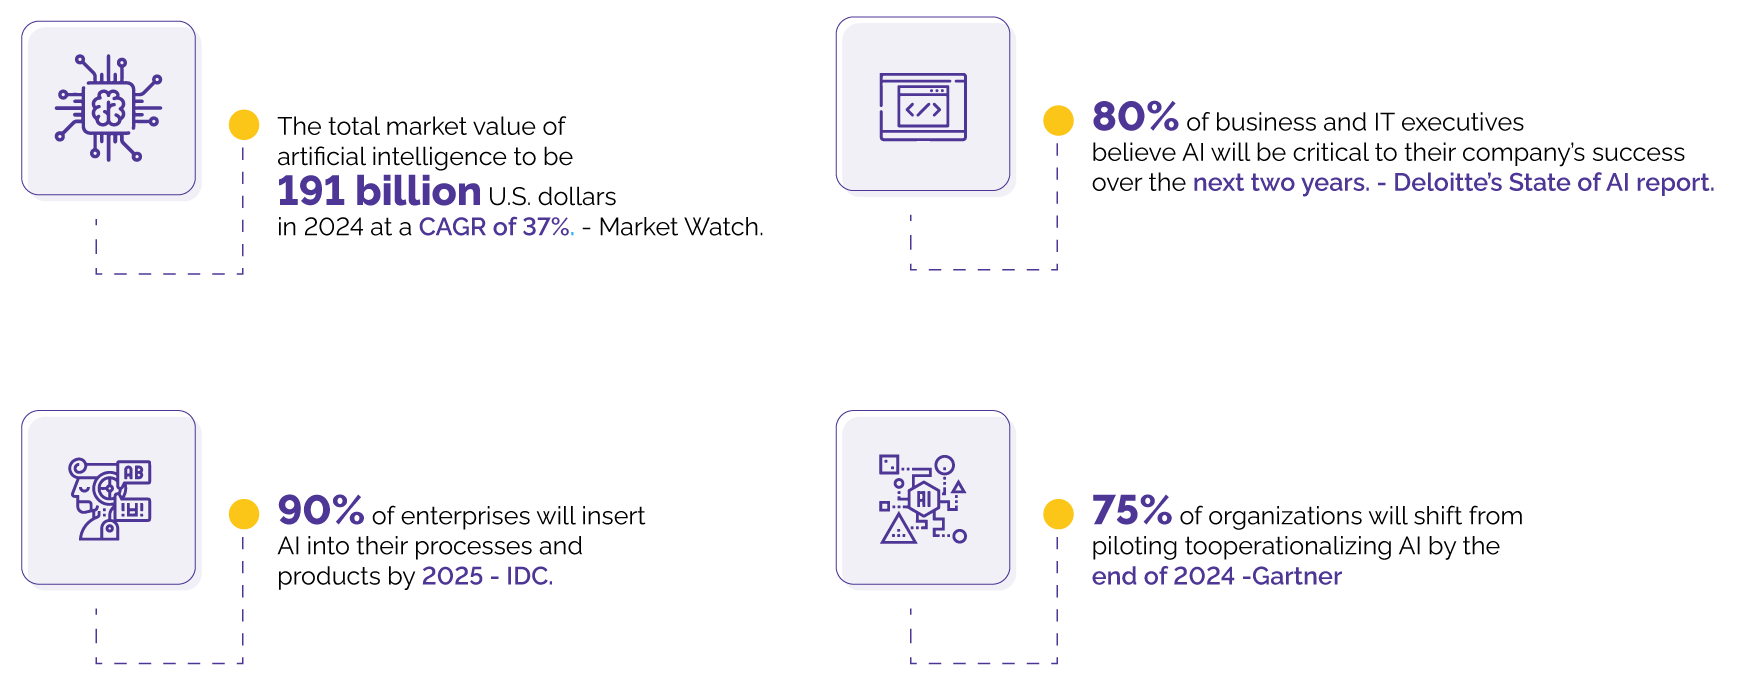
  • What is Explainable AI and why is it important? 

    What is Explainable AI and why is it important? 

    Traditional Black Box AI systems automate decision making and offer limited visibility into how the algorithms work. In a time, when transparency is everything, can we really trust artificial intelligence systems? In this article, we explore the concept of AI Bias and the role of Explainable AI in eliminating AI Bias and increasing model transparency

    What is AI Bias?

    AI bias is defined as “a phenomenon that occurs when an algorithm produces results that are systemically prejudiced due to erroneous assumptions in the machine learning process.” This happens when AI models ingest societal biases leading to flawed outcomes. The examples are many: Microsoft’s bot Tay learning racial slurs and Twitter’s photo cropping algorithm blotting out African people.

    Why it is important to eliminate AI Bias?

    Without a way to check these biases, AI models grapple with inefficiencies. Model accuracy comes under scrutiny, leaving users feeling distrustful about model recommendations. The effectiveness of model predictions also suffers because of results that reflect a skewed reality. For instance, biases in automated loan underwriting can unknowingly isolate an entire demographic of customers that are eligible for affordable loans, leading to negative brand image and lower profitability.

    Biased model outcomes also inadvertently encourage discrimination. Seeking to mechanize recruiting, Amazon designed a machine learning program, AMZN.O. It was later found that the algorithm was rating candidates in a non-gender-neutral manner, heavily preferring men over women. On deeper investigation, the fault lay with one of the datasets that used resumes submitted to the company over a period of time, most of which were from male candidates. AI biases can breed a lack of accountability in decision-making within the organization, compromising an open and transparent culture. To gain user trust, AI systems need to be responsible and free of bias. Explainable AI plays a vital role in eliminating model bias and improving AI Adoption.

    What is Explainable AI and why it matters?

    Explainable AI deals with the concept of building transparent AI systems. According to Google, Explainable AI is “a set of tools and frameworks to help enterprises understand and interpret predictions made by machine learning models.” It is used to describe an AI model, the expected impact, and potential biases. It debugs the model and gives users insights into model behaviour to improve performance.

    But perhaps one of the most pioneering features of Explainable AI is that it can resolve biases and gaps within AI models. Simply put, Explainable AI allows users to understand the path that an IT system or algorithm takes to make a decision. Being a new technology with unprecedented potential to transform business and human experiences, explainable AI is critical to gain user trust and enhance AI adoption.

    How does Explainable AI work?

    At a fundamental level, Explainable AI involves exposing the logic within black box models – and thereby any fallacies – used to drive AI outcomes. A black box model is a catch-all term used to describe a computer program designed to transform various data into useful strategies. In machine learning, these black box models are created directly from data by an algorithm, meaning that humans, even those who design them, cannot understand how variables are being combined to make predictions. The differentiator, therefore, is transparency. When AI models are made transparent, it instantly provides scope to correct human biases.

    Best practices to leverage Explainable AI and eliminate AI bias

    As the evidence suggests, AI models can embed societal biases and deploy them at scale. Feeding such biases is typically unintentional. Nevertheless, to stay ahead of risk, enterprises need ways to purposefully make AI accountable. The goal is to convert the art of making AI responsible into the science of making AI explainable.

    1) Remove bias in the underlying data

    Datasets used by AI systems are often the root source of bias. Biases in datasets occur due to two broad reasons. One is the lack of sufficient variety and distribution of data. For instance, non-representative methods of collecting, sampling, and selecting data for the model. Two, decision biases may sprout from past recorded human decisions based on flawed assumptions or societal/historical inequalities. To avoid such biases becoming part of the underlying data, one must proactively ensure that datasets with adequate representation are being used. Platforms that offer a range of granular visualizations assist data scientists in decrypting patterns, ensuring representative samples, and assessing whether the input data is skewed or not.

    2) Weed out socially or legally unacceptable correlations

    Sensitive variables such as gender, ethnicity, and race are often intentionally avoided as inputs in algorithms. However, these can be picked up from other correlated variables. For example, AI systems may derive ethnicity from geographical locations, and age from the number of times a service has been used. Data scientists must be primed, therefore, and take extra effort to identify such possibilities beforehand. Dashboards that provide visual representations of data and its correlations can greatly help data analysts understand algorithmic logic. These also allow data scientists to apply their own understanding and domain skills to debias the model.

    3) Integrate user feedback to ensure model improvements

    An AI model should mandatorily include feedback from end users about how the model functions in the real world. This requires steady, continuous, and persistent model testing to refine the model for greater levels of accuracy.

    How HyperSense Explainable AI helps eliminate AI Bias?

    Companies are wary of the implicit risk within AI models, and want solutions that help them mitigate potential negative impact. HyperSense AI Studio is one such solution. HyperSense AI Studio comes with explainable AI capabilities. It eliminates bias due to costly errors and ensures transparency in prediction, thereby improving model performance and building user trust through AI trust and governance framework. It enables organizations to build trust and confidence when putting AI models into production. It also improves accuracy and fairness when interpreting the models and algorithms.

    Key takeaway

    Building a system of trust within the AI landscape calls for well-formed ethics, governance, and frameworks. The definition of ‘AI trust’ must be deconstructed and every element transformed into a metric that is measurable and transparent. To ensure unbiased, transparent, and trustworthy results, enterprises need to interpret AI models and their predictions with Explainable AI capabilities with solutions such as HyperSense AI Studio.

    Eliminate AI Model bias with HyperSense AI Studio

    Try AI Studio for Free